
Early last month, Pensacola Mayor Ashton Hayward announced the results of the third annual City of Pensacola Community Survey that was conducted by the University of West Florida Haas Center. Nearly 70 percent of respondents said that the City of Pensacola was headed in the right direction. Most of the city services were given high ratings by the respondents.
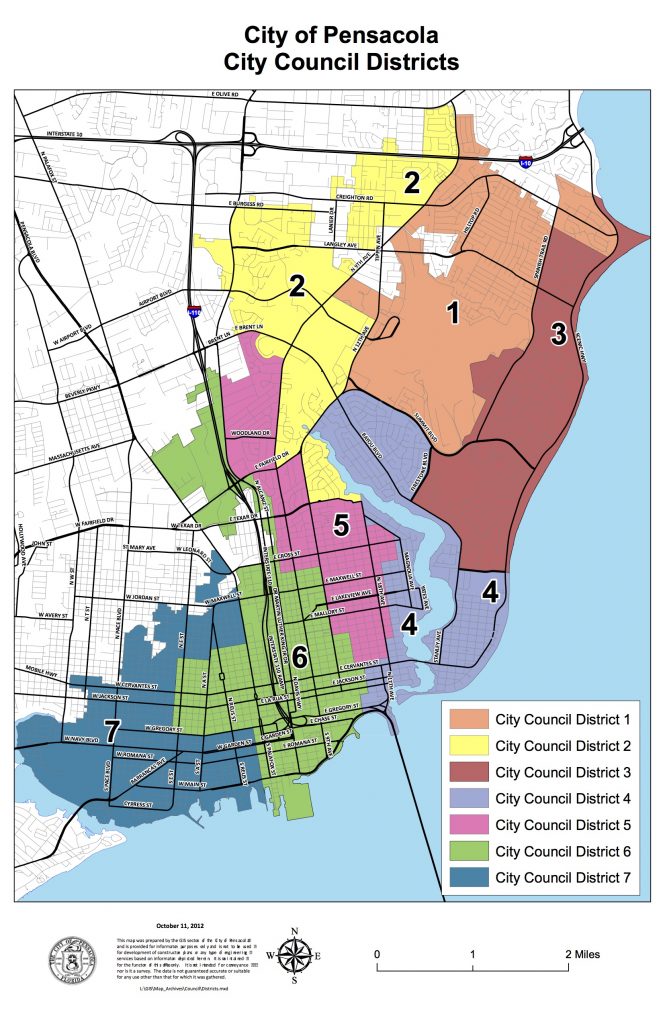
However, the survey greatly overrepresented the residents living around Bayou Texar (District 4), Cordova Park (District 3) and Scenic Highway (District 1). Those three districts contain 41.1 percent of the city residents and 45.6 percent of Pensacola’s registered voters. More than 89 percent of their voters are white. The city’s population is 30.4 percent minority.
The disparity between the number of respondents living in the two sides of Pensacola was stark. The districts that are the city’s easternmost comprised 252 of the survey’s 444 respondents, 56.8 percent. The city’s western districts, Districts 5, 6 and 7, only had 123 respondents, 27.8 percent, though they have a larger percentage of city residents, 43.3 percent.
District 7, which contains the Tanyards that has been battling City Hall over the Government Street Stormwater Project, only had 30 respondents. District 1, which has the smallest percentage of residents (12.9%), had 82 respondents.
| District | Residential | Haas
Sample |
| Distribution | # , % | |
| 1 | 12.9% | 82 – 19.7% |
| 2 | 15.6% | 42 – 10.1% |
| 3 | 13.0% | 89 – 21.3% |
| 4 | 15.2% | 81 – 19.4% |
| 5 | 14.0% | 45 – 10.8% |
| 6 | 15.8% | 48 – 11.5% |
| 7 | 13.5% | 30 – 7.2% |
Inweekly paid to have a telephone survey done of Districts 5, 6, and 7 to more accurately measure their views of the direction of the city and various city services. The Inweekly weighted survey had 66 respondents for District 7, as opposed to only 30 by the Haas Center, and had significantly different results.
Most District 7 voters (42.4%) were unsure or had no response when asked about the direction of the city. Only 37.9% responded the city was headed in the right direction.Â
| Direction of the City | Haas | Inweekly | Difference |
| Right | 57.0% | 37.9% | 19.1% |
| Wrong | 13.0% | 19.7% | -6.7% |
| Not Sure | 27.0% | 34.8% | -7.8% |
| No response | 3.0% | 7.6% | -4.6% |
While Haas Center survey reported high percentages of very satisfied and satisfied residents in District 7 for key city services – Police, Fire, Sanitation,  the Inweekly survey found the voters in District 7 less enthusiastic. Nearly half of District 7 (45.4%) was either neutral or unsure about Police Services.
Fire Services and Recreational Opportunities were the only city services that had over 50% satisfaction. The Haas study had District 7 giving Recycling and Sanitation Services the highest satisfaction percentage, but Inweekly found only 42.2% were satisfied with the service. (Note: Satisfied includes Very Satisfied and Satisfied responses; Dissatisfied includes Very Dissatisfied and Dissatisfied responses.)
| Police Services | Haas | Inweekly | Difference |
| Satisfied | 63.0% | 37.9% | 25.1% |
| Dissatisfied | 17.0% | 16.7% | 0.3% |
| Neutral/Unsure | 20.0% | 45.4% | -25.4% |
| Fire Services | Haas | Inweekly | Difference |
| Satisfied | 84.0% | 65.1% | 18.9% |
| Dissatisfied | 3.0% | 10.6% | -7.6% |
| Neutral/Unsure | 13.0% | 24.2% | -11.2% |
| Recycling, Sanitation | Haas | Inweekly | Difference |
| Satisfied | 87.0% | 42.2% | 44.8% |
| Dissatisfied | 10.0% | 28.8% | -18.8% |
| Neutral/Unsure | 3.0% | 28.8% | -25.8% |
District 7 showed little satisfaction for the Public Works categories:
| City Streets | Haas | Inweekly | Difference |
| Satisfied | 46.0% | 22.7% | 23.3% |
| Dissatisfied | 23.0% | 45.4% | -22.4% |
| Neutral/Unsure | 30.0% | 31.8% | -1.8% |
| City Sidewalks | Haas | Inweekly | Difference |
| Satisfied | 53.0% | 21.2% | 31.8% |
| Dissatisfied | 24.0% | 56.0% | -32.0% |
| Neutral/Unsure | 23.0% | 22.7% | 0.3% |
| Stormwater Infrastructure | Haas | Inweekly | Difference |
| Satisfied | 46.0% | 24.2% | 21.8% |
| Dissatisfied | 21.0% | 36.4% | -15.4% |
| Neutral/Unsure | 34.0% | 39.4% | -5.4% |
| Cleanliness | Haas | Inweekly | Difference |
| Satisfied | 60.0% | 36.3% | 23.7% |
| Dissatisfied | 17.0% | 39.4% | -22.4% |
| Neutral/Unsure | 23.0% | 24.2% | -1.2% |
Recreational opportunities garnered a 51% satisfaction percentage.
| Community Centers | Haas | Inweekly | Difference |
| Satisfied | 50.0% | 25.8% | 24.2% |
| Dissatisfied | 6.0% | 25.7% | -19.7% |
| Neutral/Unsure | 43.0% | 48.5% | -5.5% |
| Athletic Facilities | Haas | Inweekly | Difference |
| Satisfied | 56.0% | 35.7% | 20.3% |
| Dissatisfied | 7.5% | 19.0% | -11.5% |
| Neutral/Unsure | 36.5% | 45.3% | -8.8% |
| Recreational Opportunities | Haas | Inweekly | Difference |
| Satisfied | 76.0% | 51.5% | 24.5% |
| Dissatisfied | 13.0% | 37.8% | -24.8% |
| Neutral/Unsure | 10.0% | 45.4% | -35.4% |
The Inweekly found significant differences in how District 7 viewed City communications and value. The Haas report had at least half of the residents satisfied. We found less than 30%.
| City Information | Haas | Inweekly | Difference |
| Satisfied | 57.0% | 28.8% | 28.2% |
| Dissatisfied | 16.0% | 39.4% | -23.4% |
| Neutral/Unsure | 27.0% | 31.8% | -4.8% |
| Value of Services | Haas | Inweekly | Difference |
| Satisfied | 50.0% | 22.7% | 27.3% |
| Dissatisfied | 13.0% | 45.4% | -32.4% |
| Neutral/Unsure | 36.0% | 31.8% | 4.2% |
Read City Study Detail Dist 7. In our Jan. 5 issue, we will publish the entire survey for Districts 5, 6 and 7.
——
Methodology
Through a public record request, Inweekly obtained a copy of the city’s contract with the Haas Center. The Haas Center committed to do four rounds of phone calls to collect 400 responses. There was no requirement that the respondents be proportionate to the city districts and the demographics of the city residents: “To keep the cost to a minimum, the Center cannot guarantee the results to be statistically significant at the district level.†The city paid $12,000 for the survey.
Inweekly used an interactive voice response method to conduct a 17-question telephone survey and used questions similar to the Haas Center questionnaire. The survey captured 262 completed studies within Pensacola City Districts 5, 6 and 7.
To complete the study, 8,505 telephone numbers of registered voters were supplied by the Escambia County Supervisor of Elections voter list. The polling took place Sunday, Dec. 18 over a four-hour period. After completing the weighting based on population, the study ended up with 227 completed studies – 66 responses were from District 7.
The study has a 95 percent confidence level with a margin of error of plus-or-minus 5.96 percent.