The Pensacola City Council will vote on Thursday to allocate up to $200,000 to hire a consultant to analyze the impact of urban revitalization in the CRA urban core on the Black population in the city limits. The consultant will make recommendations to mitigate the dislocation, displacement, economic loss of affordable housing and community resources in historically Black and low-income communities.
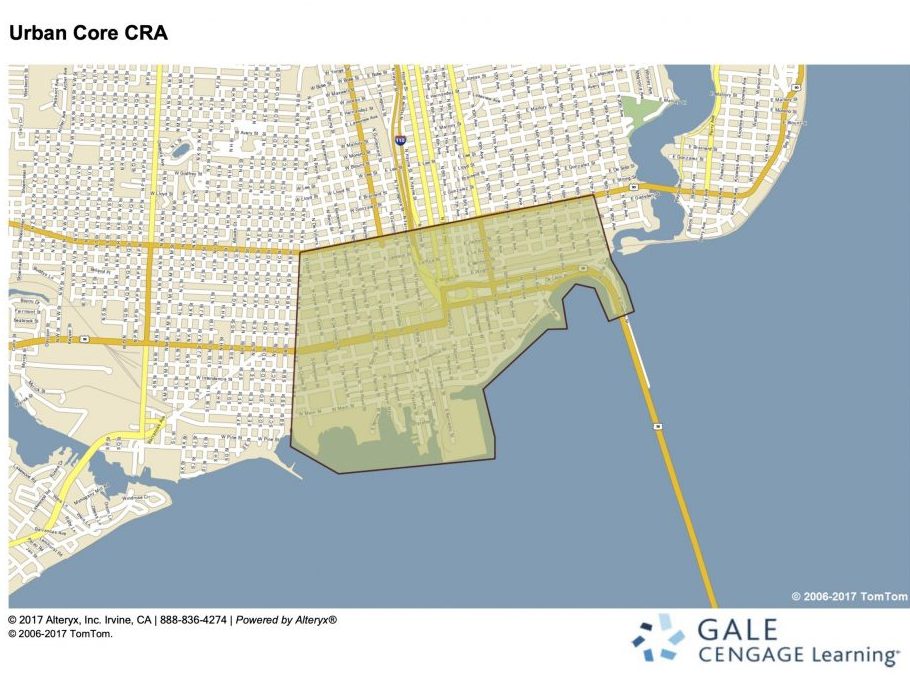
As part of the agenda item, the city supplied with a demographic analysis of the CRA since 2010 – see pdf.
Here’s what has the past 10 years:
The population increased by 110 people since 2010, but the majority of the growth happened from 2010-2016.
2010 | 2021 | |||
Census | Projections | Difference | Since 2016 | |
Total population | 2911 | 3021 | 110 | -1 |
White | 1819 | 1900 | 81 | -14 |
Black | 935 | 924 | -11 | -4 |
Native American | 16 | 15 | -1 | 0 |
Asian | 53 | 70 | 17 | 7 |
Some Other Race | 21 | 26 | 5 | 1 |
Two or More Races | 66 | 85 | 19 | 9 |
Most the growth happened in the 25-34 age group, followed by 65-74 group. The 45-54 group had the biggest decline.
2010 | 2021 | |||
Ages | Census | Projections | Difference | Since 2016 |
0 to 4 | 128 | 131 | 3 | -1 |
5 to 14 | 229 | 240 | 11 | 12 |
15 to 19 | 139 | 113 | -26 | -17 |
20 to 24 | 247 | 168 | -79 | -75 |
25 to 34 | 429 | 602 | 173 | 54 |
35 to 44 | 351 | 350 | -1 | 20 |
45 to 54 | 514 | 392 | -122 | -73 |
55 to 64 | 424 | 465 | 41 | 7 |
65 to 74 | 216 | 316 | 100 | 62 |
75 to 84 | 154 | 151 | -3 | 8 |
85+ | 76 | 90 | 14 | 3 |
The household incomes – average, median and per capita – increased with the majority happening since 2016.
2010 | 2021 | |||
Household Income | Census | Projections | Difference | Since 2016 |
Avg HH income | Â $Â Â Â Â 54,183 | Â $Â Â Â Â 70,074 | Â $Â Â Â 15,891 | Â $Â Â Â Â 11,471 |
Median HH income | Â $Â Â Â Â 33,249 | Â $Â Â Â Â 45,566 | Â $Â Â Â 12,317 | Â $Â Â Â Â Â Â 9,170 |
Per Capita income | Â $Â Â Â Â 27,667 | Â $Â Â Â Â 35,743 | Â $Â Â Â Â Â 8,076 | Â $Â Â Â Â Â Â 6,186 |
Housing units increased by 360, the majority from 2010-2016. The occupancy rate is slightly up. The CRA has more renters and fewer homeowners.
2010 | 2021 | |||
Housing Units | Census | Projections | Difference | Since 2016 |
Total | 1471 | 1831 | 360 | 322 |
Occupancy rate | 81.5% | 83.4% | 1.9% | 0.2% |
Owner Occupied | 491 | 427 | -64 | -3 |
Renter Occupied | 713 | 796 | 83 | 14 |
CRA has more people with college degrees.
2010 | 2021 | |||
Higher Education | Census | Projections | Difference | Since 2016 |
Some college, no degree | 483 | 471 | -12 | 7 |
Associates | 178 | 232 | 54 | 12 |
Bachelor’s | 509 | 588 | 79 | 22 |
Graduate | 273 | 316 | 43 | 18 |
The data reviewed for this study should start with the 1960 census to get a longer view perspective of what was happening downtown when the Pensacola Downtown Improvement Board was formed and then the Pensacola Community Redevelopment Agency (CRA). What have either done to create “affordable” housing? The CRA’s “Pensacola Inner City Community Redevelopment Area” (4,611 acres) where the CRA commission exercises legal jurisdiction covers about 30% of the city legally designated as “blighted” to include all of North Hill and most of East Hill, and most everything west of 17th Avenue and south of Baars Streets. The Urban Core Community Redevelopment Agency – often confused with the “agency” the CRA – was formed in 1984 and covers only two square miles south of Cervantes Street west of 17th Avenue and east of “A” Street. The CRA commission needs also to review the core documents that led to the formation of both the CRA and the Urban Core CRA. It also needs to review Chapter 163 Part III, Florida Statutes, to understand what the CRA is “supposed” to do. Other than Councilwoman Myers, I have never found any council member to be familiar with the state laws that govern the purpose and operation of the CRA. In 2016, at a CRA meeting where I think I was the only citizen present, I discussed this gentrification issue with the Housing Department Director Marcie Whitaker. I suggested that the gentrification of downtown was an issue that would eventually boil over to the top. She has had five years to get ready. I recall also Movement for Change President LeRoy Boyd testifying before the City Council in early 2008 expressing his concern that the downtown redevelopment plans then under discussion seemed designed to force many African-American families out of their homes. Mayor Hayward was very clear also that he wanted to replace the current city residents with young, urban hipsters. In truth, the city’s population has aged a lot in recent years as so many families with kids have fled to Santa Rosa County for low crime and great schools. I often have wondered how many city employees live in Santa Rosa County. As of the 2010 census, the city has about less than half the number of children it had in 1970, another reason to look at this issue from a longer viewpoint. To be clear, the flippant use of “affordable housing” to describe what is being done in downtown is shocking. As one example, when the Southtowne project demanded a $6+ million tax break, the public was told it was needed to provide affordable housing for “police officers, firefighters, teachers and those sorts of people.” John Myslak was further quoted in the PNJ saying that the “only” reason the Studer’s wanted the EDATE for their project was to provide affordable housing. No one would call those apartments “affordable.” Another related housing issue to look at is all empty houses in the entire city to include those converted full-time into Airbnbs and those that are used for illegal businesses like the car wholesale business I can see from my house. There are five homes I can see from my house where no one lives.