Santa Rosa County had another COVID-19 related death and now matches Escambia’s total of 3. Â Santa Rosa had 105 cases as of 6 Â p.m. Friday – a 219% increase in a week.
The Santa Rosa County Health Dept. attributes the increase in COVID-19 cases to more testing: Â “As more individuals in Santa Rosa County are tested for COVID-19, the Florida Department of Health is seeing an increase in the number of cases throughout the county.”
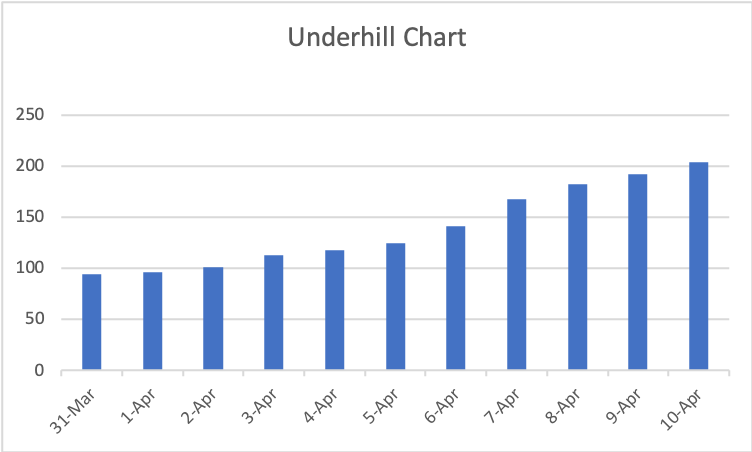
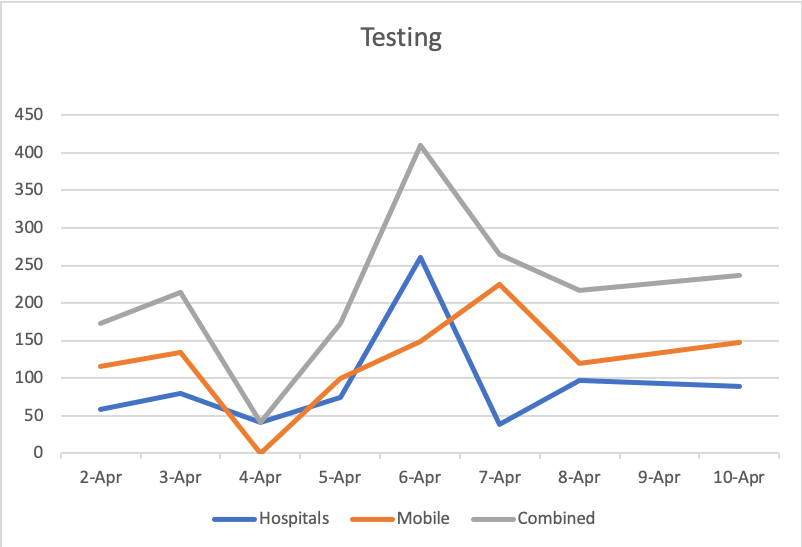
Escambia County cases are moving up steadily as testing decreases – total 204 positive cases. The county now has 20 cases attributed to local long-term care facilities. Escambia is tied for seventh for counties with most cases in nursing homes.
Which ones? The county won’t report it, blaming the governor’s office.
The nursing homes didn’t respond to Inweekly emails asking them to voluntarily self-report their COVID-19 status. Instead, the newspaper learned the nursing home industry has requested criminal and civil immunity.
Escambia County Commissioner Jeff Bergosh believes classifying the SITREP – the EOC report that revealed to Inweekly the risk of cases in a local assisted living facility – was a “huge mistake.” Â He has requested an online special meeting of the county commission to discuss it.
| 4/9/20 | 4/10/20 | |||
| 6 p.m. | 6 p.m. | Increase | ||
| Total Cases | 16826 | 17968 | 1142 | 6.79% |
| Florida Residents | 16323 | 17448 | 1125 | 6.89% |
| Non-Fla. | 503 | 520 | 17 | 3.38% |
| Deaths | 371 | 419 | 48 | 12.94% |
| Escambia | 192 | 204 | 12 | 6.25% |
| Okaloosa | 83 | 85 | 2 | 2.41% |
| Santa Rosa | 96 | 105 | 9 | 9.38% |
| Broward | 2480 | 2679 | 199 | 8.02% |
Top 20 CountiesÂ
| Rank | County | Population | Cases | Per 30K |
| 1 | Dade | Â Â Â 2,715,516 | 6300 | Â Â Â Â Â Â Â Â Â 69.60 |
| 2 | Broward | Â Â Â Â Â Â 924,229 | 2679 | Â Â Â Â Â Â Â Â Â 86.96 |
| 3 | Palm Beach | Â Â Â 1,446,277 | 1431 | Â Â Â Â Â Â Â Â Â 29.68 |
| 4 | Orange | Â Â Â 1,321,194 | 902 | Â Â Â Â Â Â Â Â Â 20.48 |
| 5 | Hillsborough | Â Â Â 1,378,883 | 676 | Â Â Â Â Â Â Â Â Â 14.71 |
| 6 | Duval | Â Â Â Â Â Â 924,229 | 618 | Â Â Â Â Â Â Â Â Â 20.06 |
| 7 | Lee | Â Â Â Â Â Â 718,679 | 572 | Â Â Â Â Â Â Â Â Â 23.88 |
| 8 | Pinellas | Â Â Â Â Â Â 957,875 | 431 | Â Â Â Â Â Â Â Â Â 13.50 |
| 9 | Collier | Â Â Â Â Â Â 363,922 | 327 | Â Â Â Â Â Â Â Â Â 26.96 |
| 10 | Osceola | Â Â Â Â Â Â 338,619 | 305 | Â Â Â Â Â Â Â Â Â 27.02 |
| 11 | Polk | Â Â Â Â Â Â 668,671 | 241 | Â Â Â Â Â Â Â Â Â 10.81 |
| 12 | Seminole | Â Â Â Â Â Â 455,086 | 238 | Â Â Â Â Â Â Â Â Â 15.69 |
| 13 | Sarasota | Â Â Â Â Â Â 412,144 | 211 | Â Â Â Â Â Â Â Â Â 15.36 |
| 14 | Escambia | Â Â Â Â Â Â 311,522 | 204 | Â Â Â Â Â Â Â Â Â 19.65 |
| 15 | Manatee | Â Â Â Â Â Â 373,853 | 200 | Â Â Â Â Â Â Â Â Â 16.05 |
| 16 | Volusia | Â Â Â Â Â Â 527,634 | 190 | Â Â Â Â Â Â Â Â Â 10.80 |
| 17 | Alachua | Â Â Â Â Â Â 263,148 | 167 | Â Â Â Â Â Â Â Â Â 19.04 |
| 18 | St. Johns | Â Â Â Â Â Â 235,503 | 165 | Â Â Â Â Â Â Â Â Â 21.02 |
| 19 | Lake | Â Â Â Â Â Â 335,362 | 149 | Â Â Â Â Â Â Â Â Â 13.33 |
| 20 | St. Lucie | Â Â Â Â Â Â 305,591 | 146 | Â Â Â Â Â Â Â Â Â 14.33 |
The Charts
Underhill Chart – Total cases by day
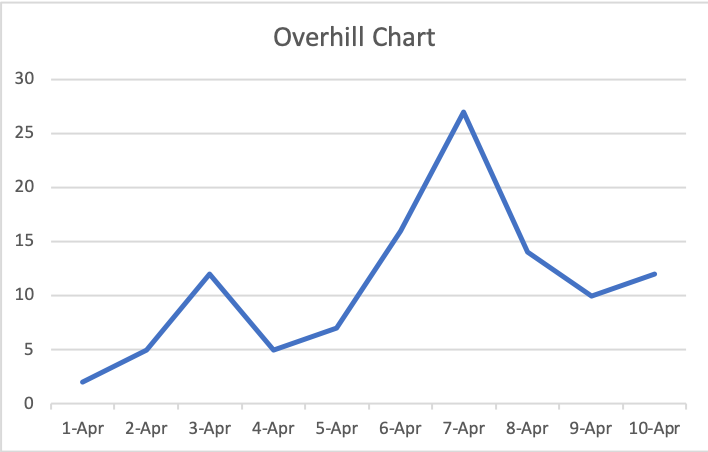
Overhill Chart – New cases each day
Testing


